Español
In social relationship studies, understanding the territory does not only involve describing it, but also collecting and analysing data and information. This allows us to interpret how these interact with people, the environment and the project itself in a specific territory.
In this process, at EHS Techniques we believe that the use of tools such as Geographic Information Systems (GIS) and graphic elements for data representation is a fundamental pillar for the development and design of a Social Engagement Plan.
Why do Geographic Information Systems make a difference in social relationships?
In social relationship studies, it is not only important ‘what’ happens, but also ‘where’ it happens. The spatial dimension is crucial to understanding the real scope of any project. GIS tools allow us to detect and identify elements of the territory that we usually overlook or ignore in a typical descriptive analysis.
In this regard, we use QGIS to work with a great deal of territorial information: administrative boundaries, population centres, transport infrastructure, land use, protected natural areas, heritage elements, etc. Based on this information, we can measure distances between a project and population centres. We can also identify possible impacts on protected areas, analyse connectivity and road access, and carry out numerous complementary territorial analyses.
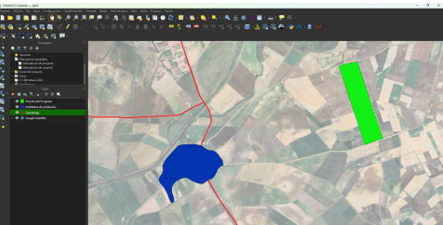
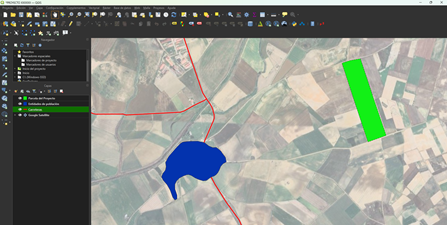
Case study: In a biomethane plant project, we were aware of the presence of a nearby residential development. However, we were not fully aware of the actual impact of the project on this development until we visualised the population layer in QGIS. In this case, the use of GIS tools helped to identify a potential risk of social unrest that might otherwise have gone unnoticed. The image below shows an example that takes into account transport infrastructure, population centres and the location of a project.
How do graphic elements help us transform objective data into social and strategic decisions?
If GIS helps us understand the ‘where,’ graphic elements allow us to interpret the “how” and the ‘who.’ Based on objective data, we create graphs, tables, maps, and other visual resources that give meaning to the information gathered from various sources.
In this way, graphic elements facilitate understanding of the social complexity of a given territory, enable trends to be detected, anticipate possible sources of conflict and represent territorial weaknesses and strengths, among other aspects. Stakeholder mapping is a good example of this, as it is a graphic representation with a subjective component. It is constructed from objective information of a political, tourist, economic and social nature, among others.
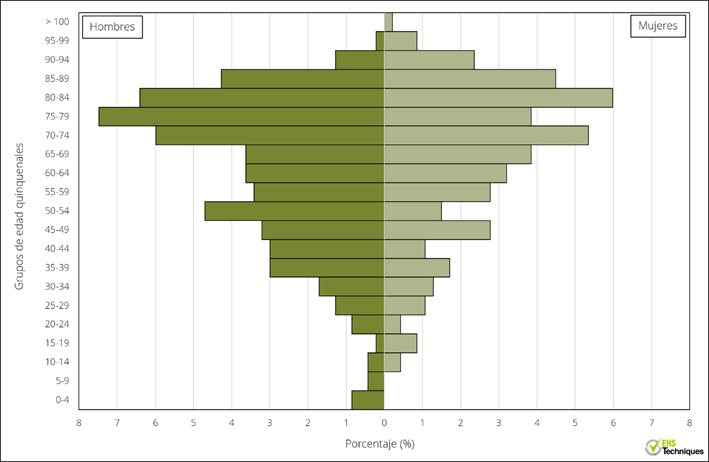
Case study: When analysing the demographic structure of a municipality, we start with official population data. This data is then processed and represented using a population pyramid. Without this, the data would be reduced to mere figures; however, by visualising it, it becomes a key tool for social interpretation and strategic decision-making. The example below shows a population with a high degree of demographic ageing.